
Between 9 September and 7 October 2026, someone used stolen service account credentials to get into PingCAP's internal systems, copy data and take source code. PingCAP, the company behind TiDB, says it became aware on 7 October. Gergely Orosz summed it up in The Pragmatic Engineer as attackers having near-total control-plane access "for a whole month".
A month. Not because nobody had logs, presumably, but because nobody was watching what those credentials were doing.
Now give that service account a language model and a set of tools. That is what an AI agent is. If you can't answer "what did the agent call, with whose permission, and what did it cost?" within minutes, you can't govern it.
The short answer: AI agent observability means recording every agent run as a trace: one invoke_agent span, a chat span per model call and an execute_tool span per tool call, using the OpenTelemetry GenAI semantic conventions. Add your own governance fields (policy decision, rule, approval id, cost) to each tool span. Then send the traces over OTLP to any backend: Langfuse, Arize Phoenix, LangSmith or Datadog.
Key takeaways
- Trace agents with OpenTelemetry, not a vendor SDK, so you can change backends without re-instrumenting. Langfuse, Phoenix, LangSmith and Datadog all ingest OTLP.
- The GenAI conventions are still at Development status and now live in their own repository. Expect renames.
- The spec covers debugging. Governance fields (policy rule, approver, the approved arguments hash, cost) are yours to add.
- Prompts, tool arguments and results are sensitive. The spec leaves content capture off by default. Keep it that way in production and never put secrets or raw PII in a span.
What is an agent trace, and why isn't logging enough?
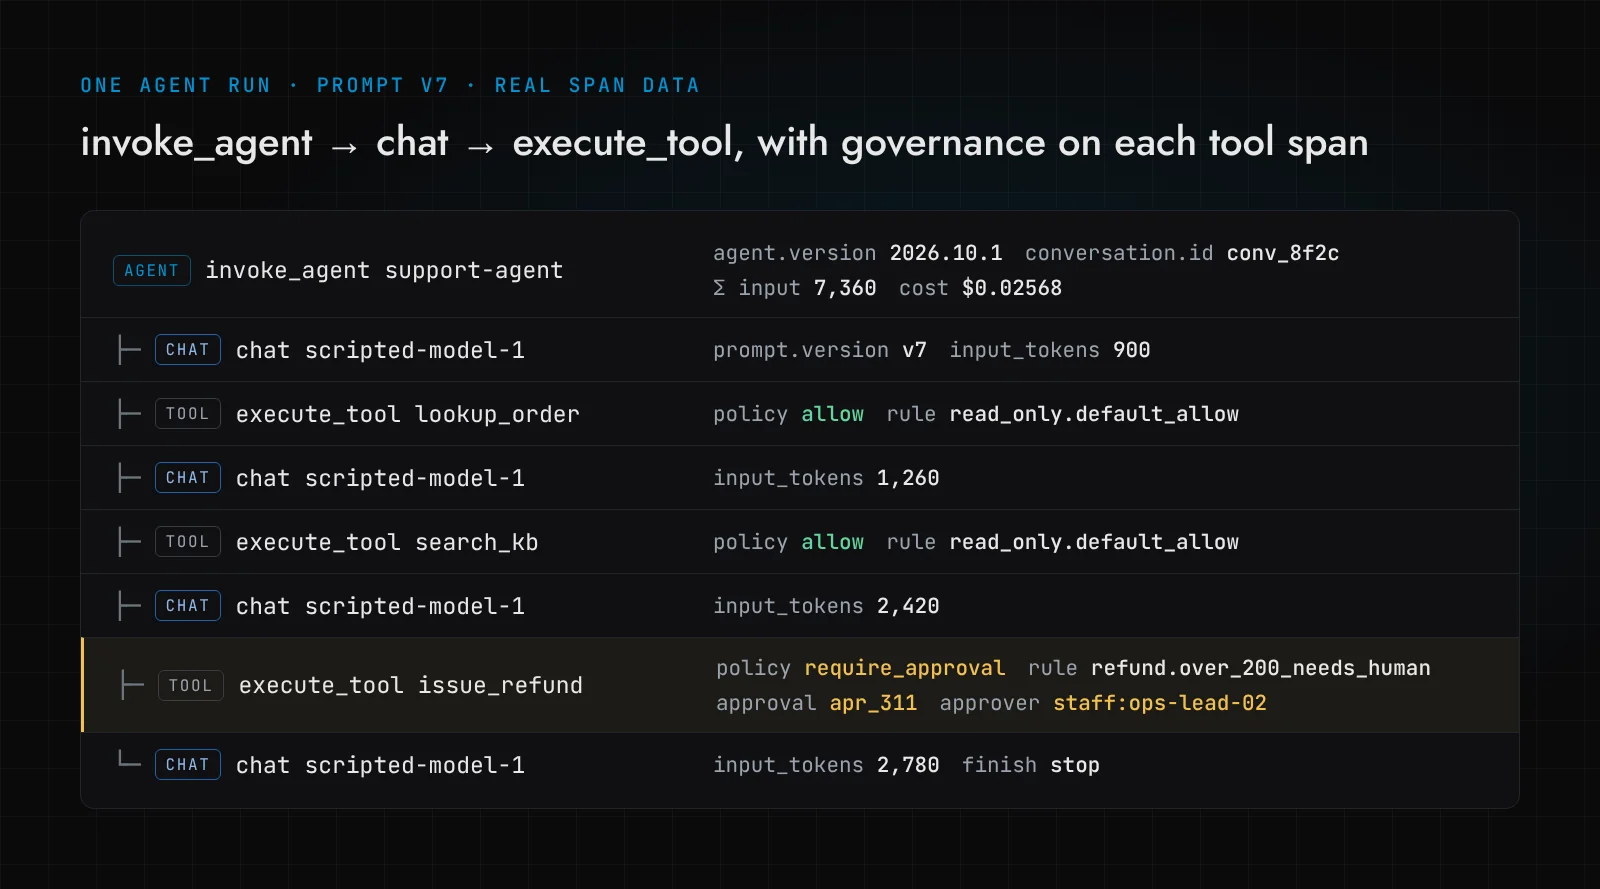
A log line says "refund issued". A trace says the refund came from conversation conv_8f2c, after the model's fourth call, through execute_tool issue_refund, which the policy engine marked require_approval under rule refund.over_200_needs_human, approved as apr_311, by agent version 2026.10.1 running prompt v7. It's the same event with its whole cause attached.
Agents make this matter more than usual. A normal service does what its code says. An agent decides at runtime which tools to call and in what order, so the code tells you what's possible and only the trace tells you what actually happened.
At Devs Core our governance approach starts from "the model proposes, deterministic code decides". The trace is how you check later that the code really did decide.
What do the OpenTelemetry GenAI semantic conventions define?
The OpenTelemetry GenAI conventions give agents a shared vocabulary. One thing changed recently that a lot of tutorials haven't caught up with: the GenAI pages on opentelemetry.io now say they have moved to a dedicated repository, open-telemetry/semantic-conventions-genai. Every page I checked there is marked Status: Development. Nothing is stable yet.
The spans that matter for an agent:
| Span | gen_ai.operation.name |
Name pattern | Kind |
|---|---|---|---|
| Agent run, same process | invoke_agent |
invoke_agent {gen_ai.agent.name} |
INTERNAL |
| Agent run, remote service | invoke_agent |
invoke_agent {gen_ai.agent.name} |
CLIENT |
| Model call | chat |
chat {gen_ai.request.model} |
CLIENT |
| Tool call | execute_tool |
execute_tool {gen_ai.tool.name} |
INTERNAL |
The agent spans doc also defines create_agent, invoke_workflow and a plan span for an agent's planning phase. The execute_tool span says something I'd underline: tools are often run by your own code, so you're "encouraged to follow this semantic convention for tools invoked by their own code". An auto-instrumentation library sees the model call. Only you see the tool.
The attributes you'll use most are gen_ai.agent.name and gen_ai.agent.version, gen_ai.conversation.id, gen_ai.request.model, gen_ai.usage.input_tokens and gen_ai.usage.output_tokens, gen_ai.tool.name and gen_ai.tool.call.id, and gen_ai.prompt.name and gen_ai.prompt.version. There's no standard cost attribute. That gap will matter in a minute.
Why does vendor-neutral tracing matter for agents?
Because the backend market is moving faster than your agent will. Here's what the four tools I looked at say about OpenTelemetry today, from their own docs:
- Langfuse (open source; the core is MIT-licensed) receives OTLP on
/api/public/otel, over HTTP only (gRPC isn't supported yet). It mapsgen_ai.*attributes into its own data model. Itslangfuse.*attributes take precedence, and to filter on a custom attribute you need thelangfuse.observation.metadata.*prefix. - Arize Phoenix is open source too. It is built on Arize's OpenInference conventions, and its docs say UI features that depend on OpenInference attributes are reduced for plain GenAI spans.
- LangSmith accepts OTLP at
https://api.smith.langchain.com/otel, or at/api/v1/otelon a self-hosted install. - Datadog ingests spans that follow the GenAI conventions from v1.37 onwards, or OpenInference, into what it now calls Agent Observability. You send them through the Datadog Agent in OTLP mode or through an OpenTelemetry Collector (announcement).
So you can instrument once, send to a Collector, and keep the choice of backend open. That also means your governance fields go through the same pipeline as everything else, where Collector processors can redact or drop them before they leave your network.
What does it look like on a real agent?
I wanted to see it working rather than describe it. So I wrote a small support agent: a scripted fake model (no API calls), three tools (lookup_order, search_kb, issue_refund) and one deterministic policy check. Refunds over $200 need a human. Everything uses the OpenTelemetry Python SDK 1.45.2. The tool span is the part that matters:
def execute_tool(tracer, name, args, call_id, approvals):
    with tracer.start_as_current_span(f"execute_tool {name}") as span:
        span.set_attributes(
            {
                "gen_ai.operation.name": "execute_tool",
                "gen_ai.tool.name": name,
                "gen_ai.tool.type": "function",
                "gen_ai.tool.call.id": call_id,
            }
        )
        verdict = evaluate_policy(name, args)
        span.set_attribute("app.policy.decision", verdict["decision"])
        span.set_attribute("app.policy.rule", verdict["rule"])

        if verdict["decision"] == "require_approval":
            approval = approvals.get(name)
            if not approval:
                span.set_status(Status(StatusCode.ERROR, "awaiting approval"))
                return {"error": "approval_required"}
            span.set_attribute("app.approval.id", approval["id"])
            span.set_attribute("app.approval.approver", approval["approver"])
            span.set_attribute("app.approval.args_sha256", approval["args_sha256"])
        elif verdict["decision"] == "deny":
            span.set_status(Status(StatusCode.ERROR, "denied by policy"))
            return {"error": "denied"}

        time.sleep(0.12)  # simulated tool latency
        result = TOOLS[name](**args)
        span.set_attribute("app.tool.result_bytes", len(json.dumps(result)))
        return result
Notice what isn't recorded: the tool arguments and the result. I record only the result's size. The customer appears only as a keyed hash (app.customer.pseudonym), so I can join their runs without being able to read who they are.
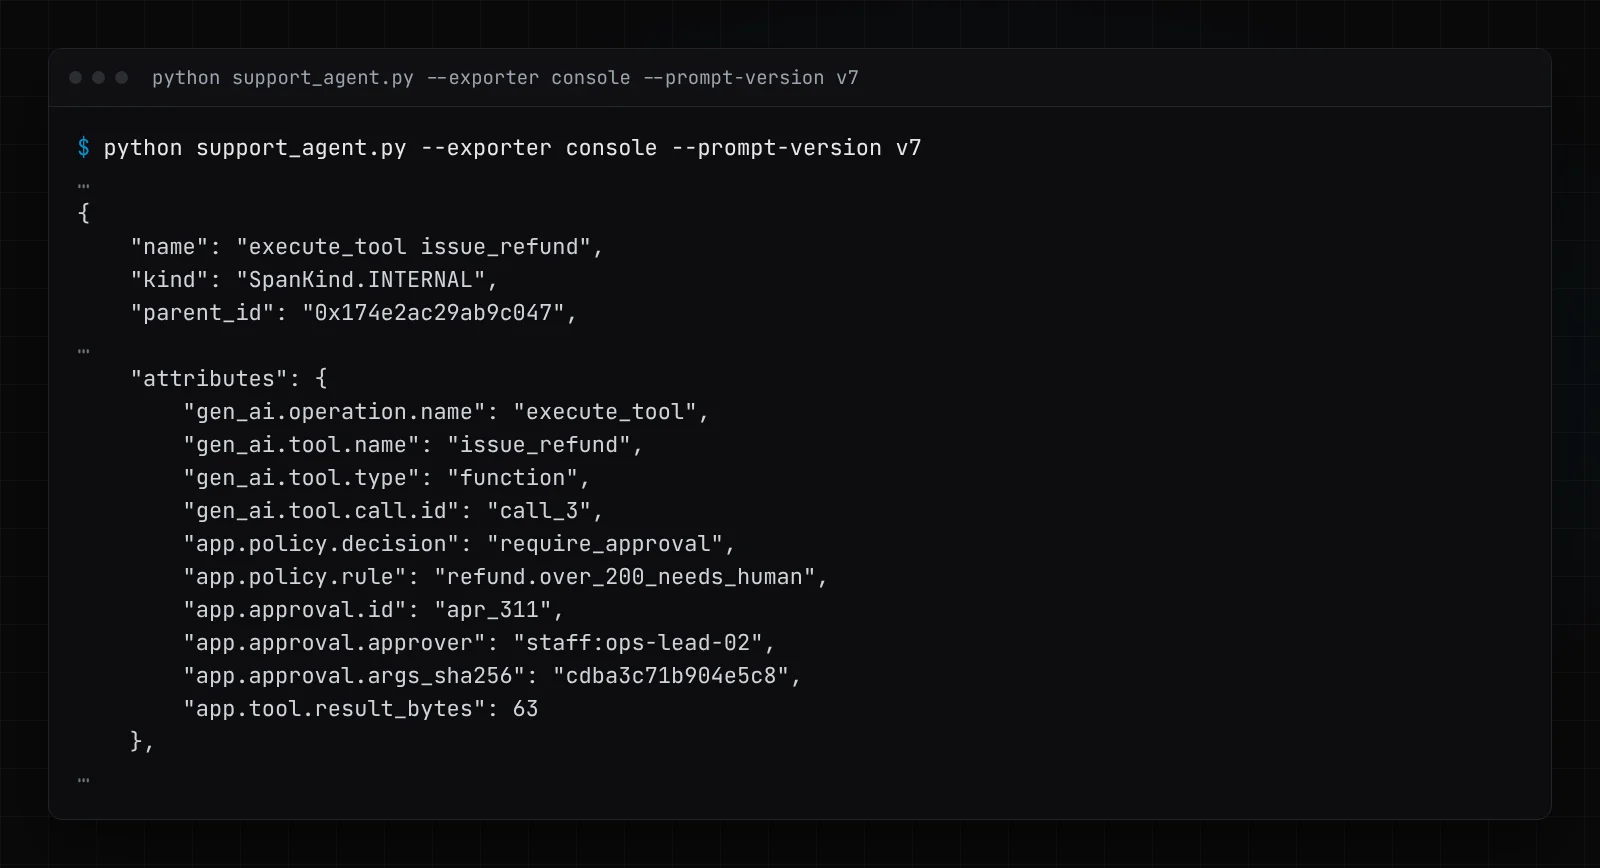
With the console exporter you get the raw span. This is the real output for the refund call:
I wanted to send it to Langfuse, but I didn't run Langfuse for this piece. Its docker-compose file runs six containers (web, worker, Postgres, ClickHouse, Redis, MinIO), and my sandbox had no Docker daemon. So the backend in the screenshots is Arize Phoenix 21.0.0 (pip install arize-phoenix, phoenix serve), which ran locally in a couple of minutes. Pointing the same code at Langfuse is configuration only. This is from Langfuse's docs, not something I tested:
# Langfuse (from langfuse.com docs; self-hosted needs >= v3.22.0)
OTEL_EXPORTER_OTLP_ENDPOINT="http://localhost:3000/api/public/otel"
OTEL_EXPORTER_OTLP_HEADERS="Authorization=Basic ${AUTH_STRING},x-langfuse-ingestion-version=4"

# What I actually ran against Phoenix
OTEL_EXPORTER_OTLP_TRACES_ENDPOINT="http://127.0.0.1:6006/v1/traces"
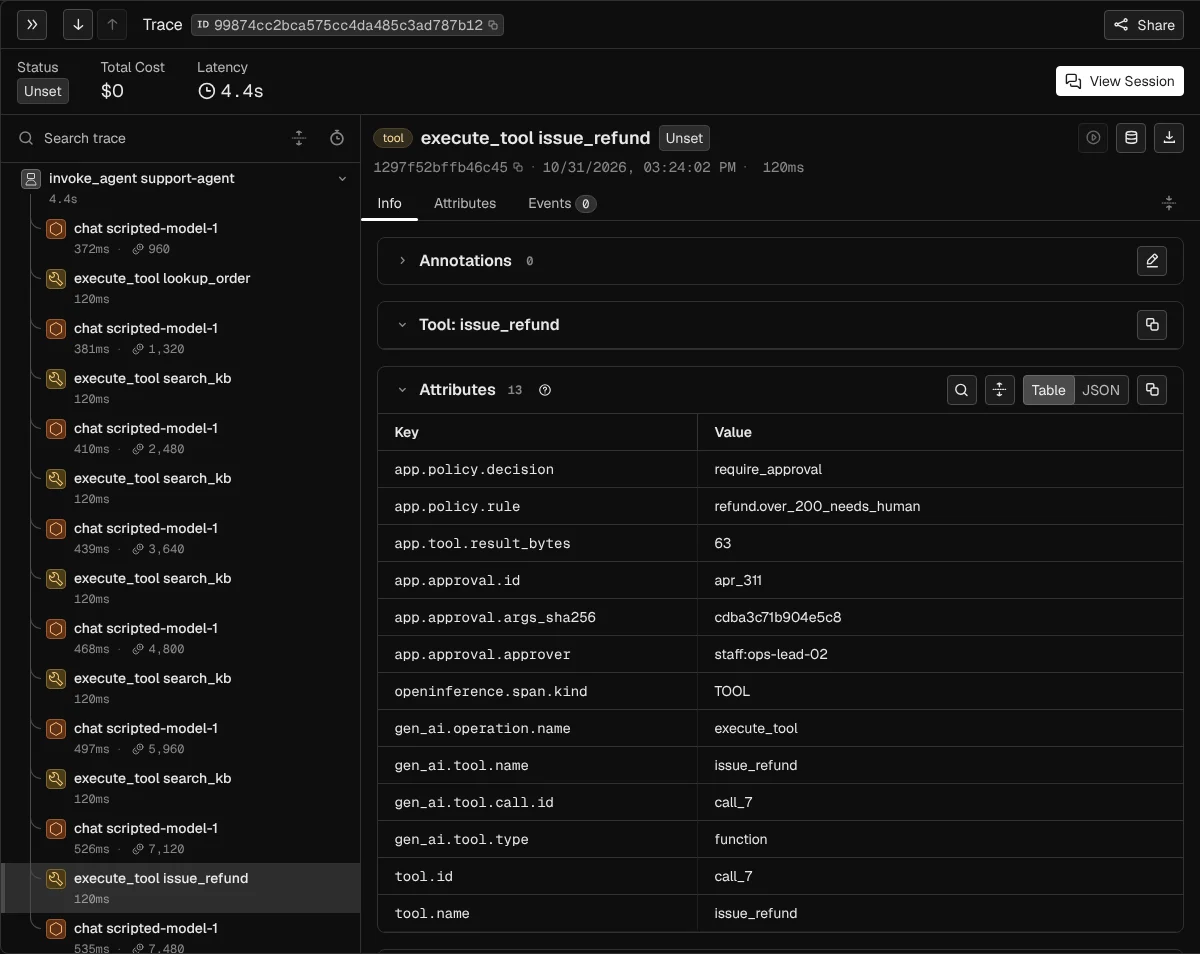
One thing surprised me. I sent only gen_ai.* attributes, and Phoenix 21 added OpenInference attributes (openinference.span.kind, llm.token_count.prompt, tool.name) next to them on ingest. Spans showed up typed as agent, LLM and tool, with token counts, without any change on my side. My custom app.* fields came through untouched.
The 4x cost bill: how a trace finds it in ten minutes
This scenario is illustrative. The numbers come from my scripted agent, not from a client.
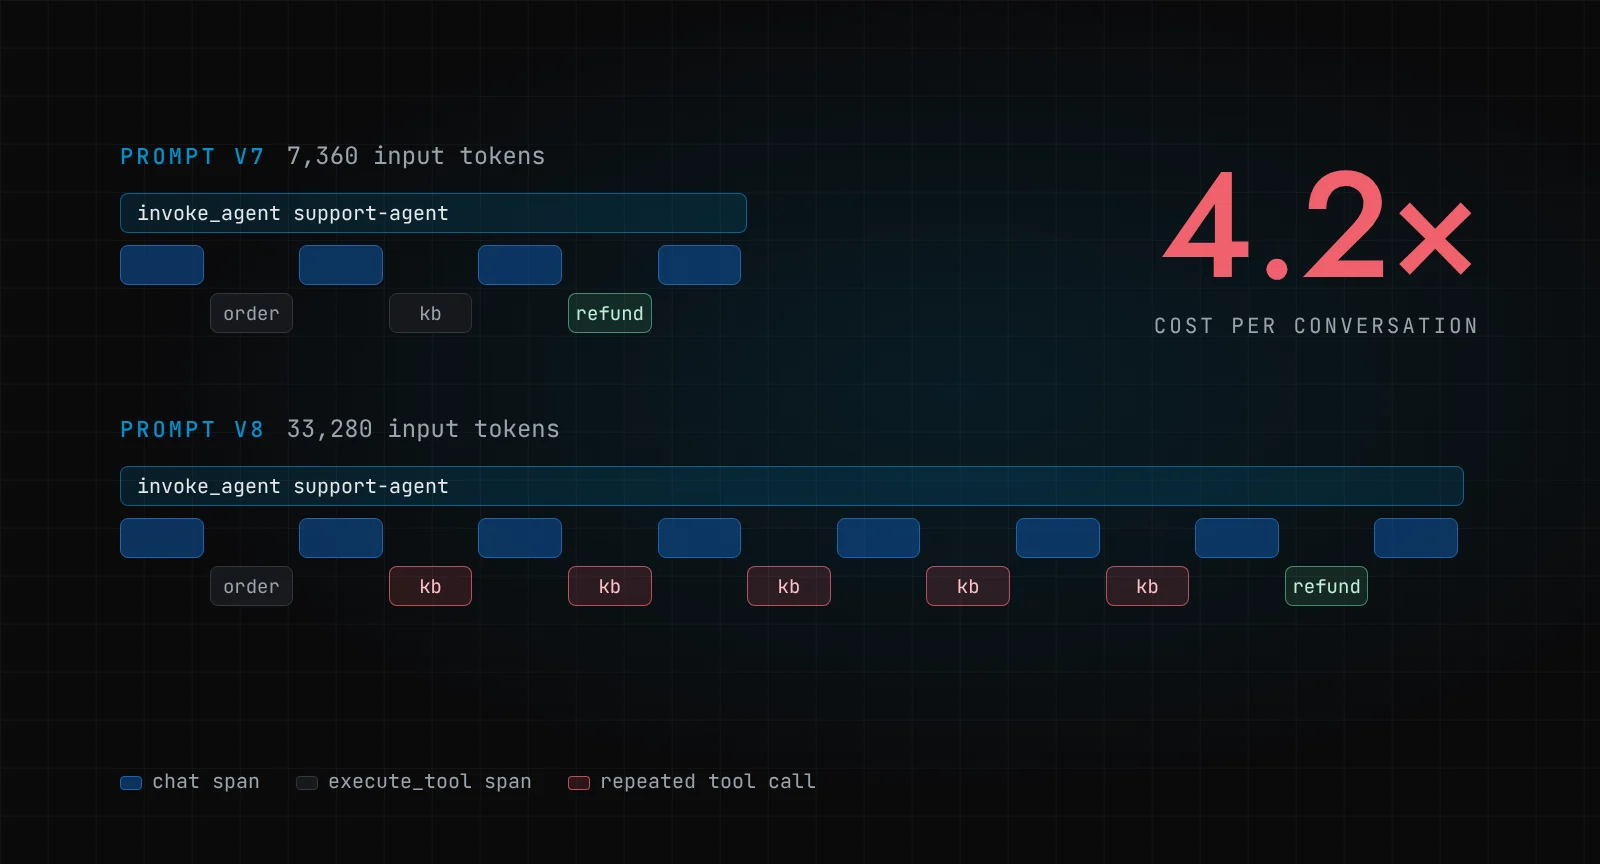
On Monday the support agent costs what it did last week. By Thursday finance asks why the model bill has quadrupled. Nobody changed the model. Somebody did change the prompt: v8 added "always check the knowledge base before answering refunds".
Without traces you'd be reading prompts and guessing. With them, you sort runs by gen_ai.usage.input_tokens and open the most expensive one:
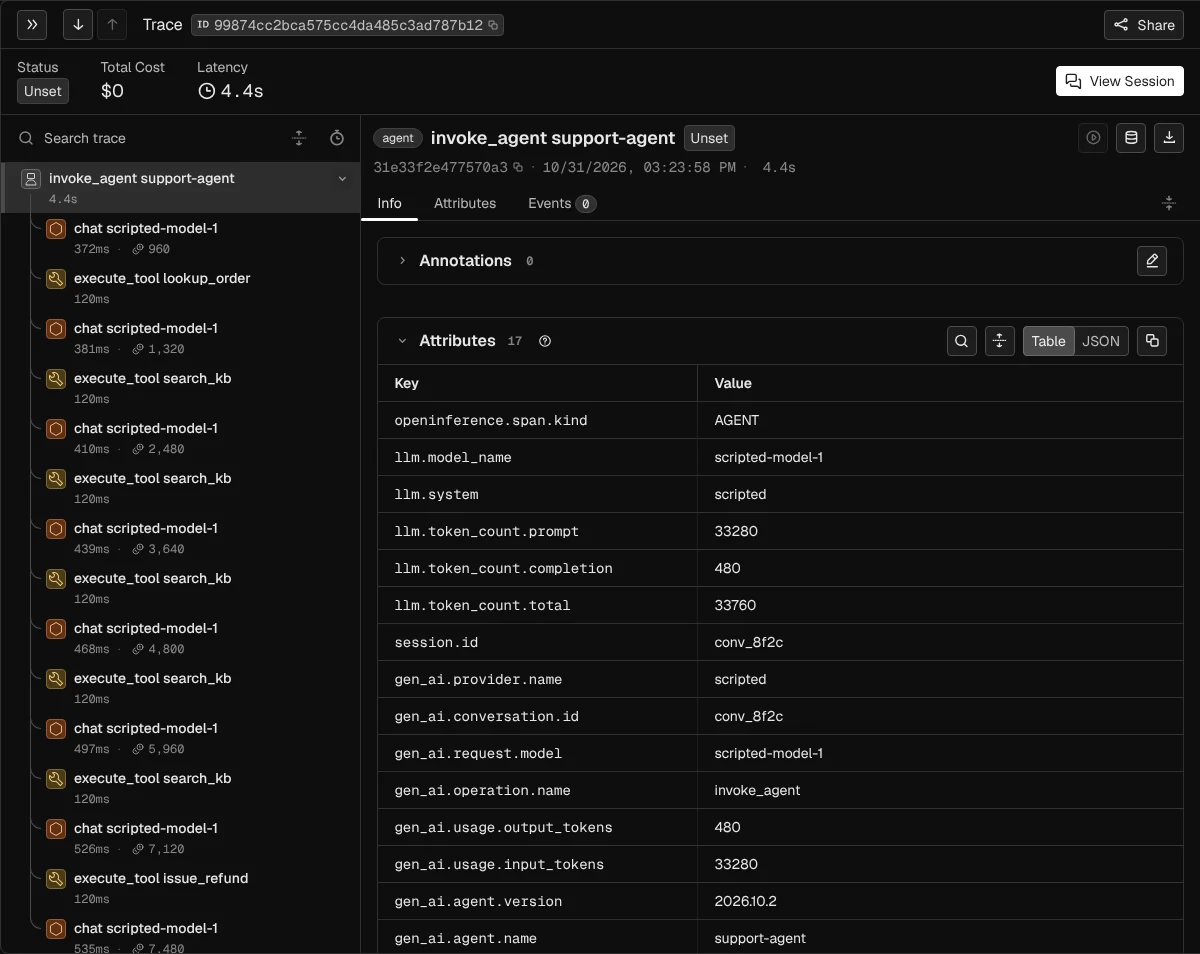
Five search_kb calls where v7 made one. Every result gets pasted back into the context window, so each later chat span carries more tokens than the one before (Phoenix shows input plus output): 960, 1,320, 2,480, 3,640, 4,800 and on. The run uses 33,280 input tokens against 7,360 for v7, and my app.cost.usd goes from $0.02568 to $0.10704. That's 4.2x. Because gen_ai.agent.version and gen_ai.prompt.version are on the spans, you can group by version and see the jump line up with the deploy. Roll back the prompt and you're done.
A detail worth knowing: Phoenix shows Total Cost $0 for this trace. It works out cost from its own model price table, and "scripted-model-1" isn't in it. Langfuse reads a non-standard gen_ai.usage.cost. The spec has no cost attribute at all. If cost is part of your governance (and it should be, see budgeting for agent costs), record it yourself, computed from your contracted prices. Then enforce budgets before the call, in a gateway, as our cost-control piece describes. A trace tells you about the overspend afterwards. A budget check stops it.
What should you record for governance on top of debugging?
The spec answers "what happened?". An auditor, or you at 2 a.m., will also ask "who allowed it?":
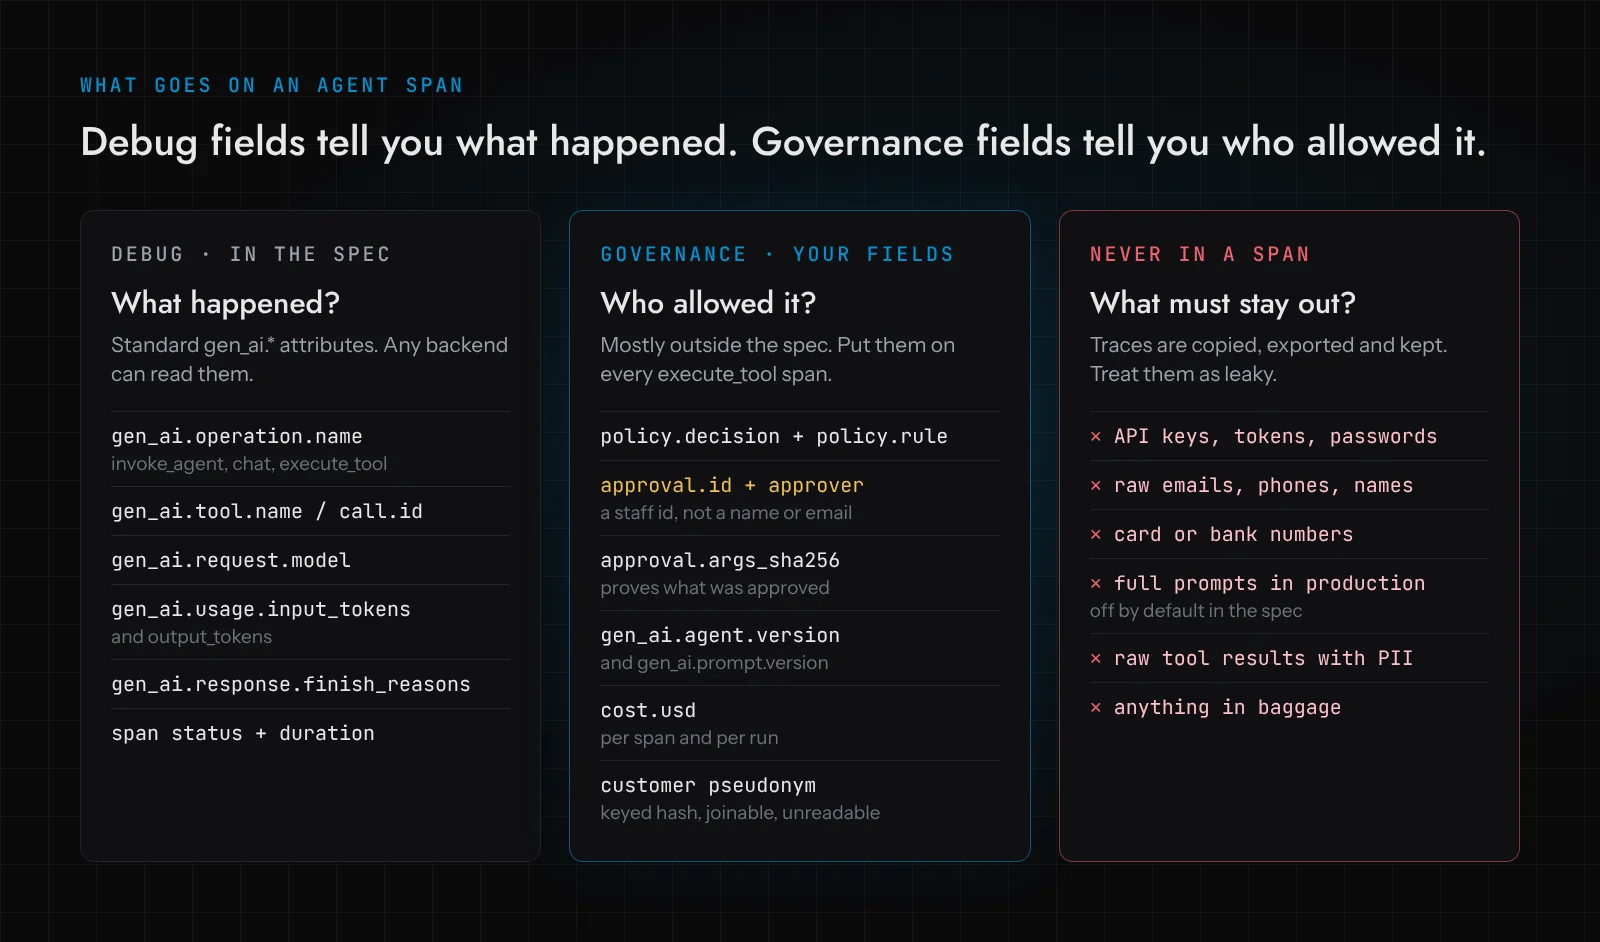
On every execute_tool span I'd record:
- The policy decision and the rule that produced it. Record "allow under
read_only.default_allow", not just "allowed". When a rule is wrong, you can find every call it let through. - The approval id, the approver as a staff id, and a hash of the exact arguments approved. That's the Phoenix screenshot below. The hash lets you check the action that ran is the one somebody approved.
- Agent version, prompt name and version, model. Without these, a behaviour change can't be traced to a deploy.
- Cost, per model call and summed on the root span.
Here's the trade-off nobody likes saying out loud: a trace is evidence, not a control. In October we ran 12 tests against the governance in Ware, our simulated warehouse with a real AI recovery agent. One weakness we found and fixed: an approval was checked in one transaction and executed in another without a re-check, so a change in between went unseen. A trace would have shown a valid approval id on that span. It still would have been the wrong action. The fix belonged in the executor, not in the telemetry.
Traces are also sampled, buffered and editable by whoever runs the backend. For the record you'd show a regulator, you want an append-only, hash-chained log, which is the subject of the audit trail article. Use traces to find things fast. Use the audit log to prove them.
What should never go into a trace?
Telemetry gets copied to vendors, kept for months and read by people who'd never get production database access. Treat it as leaky.
The GenAI conventions agree. Instrumentations "SHOULD NOT capture" instructions, inputs and outputs by default. If an instrumentation offers content capture it must have an opt-in setting, OTEL_INSTRUMENTATION_GENAI_CAPTURE_CONTENT, which defaults to NO_CONTENT. For production, the spec recommends storing content externally, under separate access controls, and recording only references on the span (content capture section). gen_ai.tool.call.arguments and gen_ai.tool.call.result each carry a "may contain sensitive information" warning.
My rules: no secrets, tokens or keys anywhere, including error messages. No raw emails, phone numbers or names; use a keyed pseudonym. No card or bank data. No full prompts in production unless the store meets your data rules. And nothing sensitive in OpenTelemetry baggage, which Langfuse's own docs point out is propagated to downstream services and third-party APIs.
Then add a redaction processor in the Collector as a backstop, because one day someone will log a whole request object.
Where to start
If you run one agent today, instrument the tool calls by hand this week. That means a few dozen lines, like the code above. Add the policy and approval fields. Send everything to a local Phoenix or a Langfuse project and look at ten real runs. You'll probably find something odd in the first hour. I did, in a fake agent I'd written myself, before I'd even got to the cost bug.
If you're planning agents into ERP, CRM or finance systems and want this designed in from the start, it's part of how we build AI agents. Approvals are covered in more depth in human-in-the-loop AI agents.
Frequently asked questions
Are the OpenTelemetry GenAI semantic conventions stable?
No. As of late October 2026 the GenAI documents are marked Development, and they've moved from the main semantic conventions repo to open-telemetry/semantic-conventions-genai. Pin your instrumentation versions and expect attribute renames.
Can I send OpenTelemetry traces to Langfuse without the Langfuse SDK?
Yes. Point an OTLP/HTTP exporter at /api/public/otel with Basic auth built from your public and secret keys. gRPC isn't supported. Langfuse recommends its own SDK for Python and JavaScript because it handles Langfuse-specific attributes for you.
What is the difference between LLM tracing and agent tracing?
LLM tracing records model calls: prompt, tokens, latency. Agent tracing adds the structure around them: the invoke_agent run, every execute_tool call, and the decisions between them. For governance, the tool spans matter most, because that's where the agent changes things.
Should prompts and responses be stored in traces?
Not by default. The spec leaves content capture off, and for production it recommends storing content separately with its own access controls. Record versions, token counts and references instead.
Is a trace enough as an audit log?
No. Traces are sampled and can be changed by whoever runs the backend. Keep an append-only, tamper-evident audit log for actions and approvals, and use traces to investigate.